Skip to content

Theme

Get in touch
Stratum · Well log analysis

Well logs, read properly.

Stratum is a well log analysis app for oil and gas data. It keeps a logging job together as one project, plots every curve, helps clean them up, runs the petrophysics and writes the report.

In testingWindowsmacOSHosted for teamsLAS and DLIS
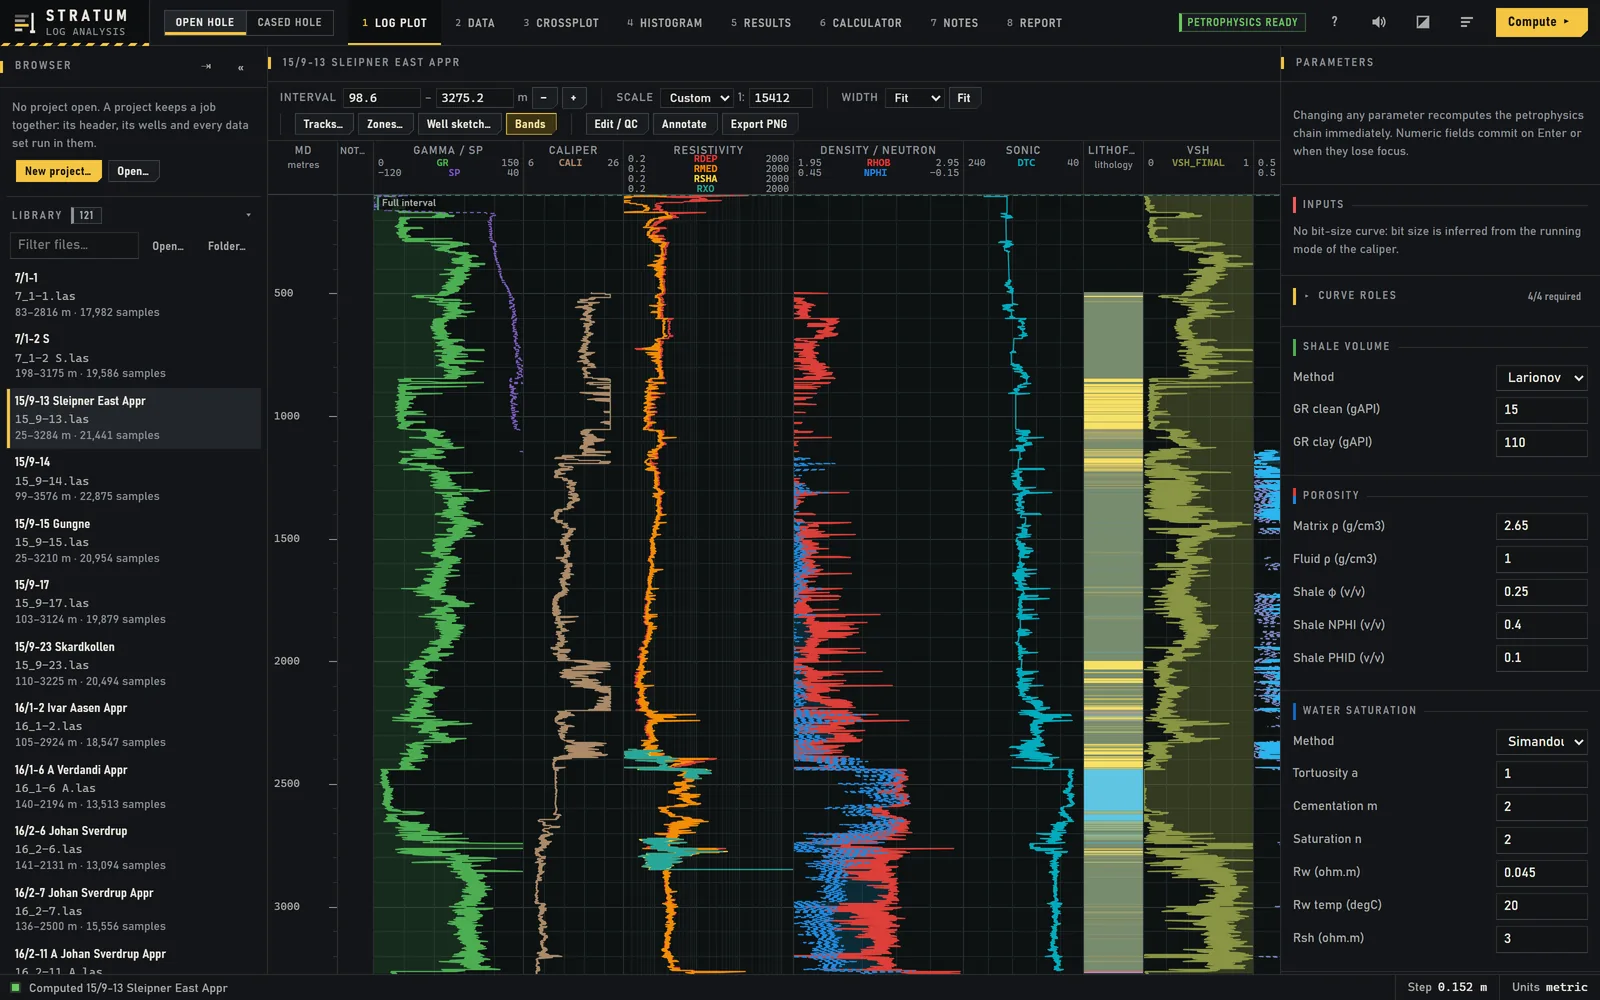
The log plot of well 15/9-13 from the North Sea: gamma ray and SP, caliper, four resistivity curves, density and neutron, sonic, a lithology column and computed shale volume, with the petrophysics parameters on the right
Well 15/9-13, from the public FORCE 2020 data set: every curve on one depth scale, with the petrophysics parameters beside it.
01 · The workflow

One project per logging job.

A project holds the job header, the wells and every data set run in them, so open hole logs, a cement bond run and later passes sit side by side.

01

Start the job

Type, company, field, well, job, date and casing shoe, and the unit system: metric, oil field or US.

02

Add the data

Pick LAS or DLIS files, name and date each run, and choose which curves to keep or rename before anything is imported.

03

Plot it

Multi track log plots at any scale, with image tracks for VDL and waveforms, zones, perforations, markers and a well sketch.

04

Clean it up

Depth shift, delete an interval, smooth, fill gaps or rescale a curve, with undo, and every module reads the edited version.

05

Interpret

The tools follow the data: petrophysics for open hole, cement bond, saturation and flow for cased hole.

06

Report

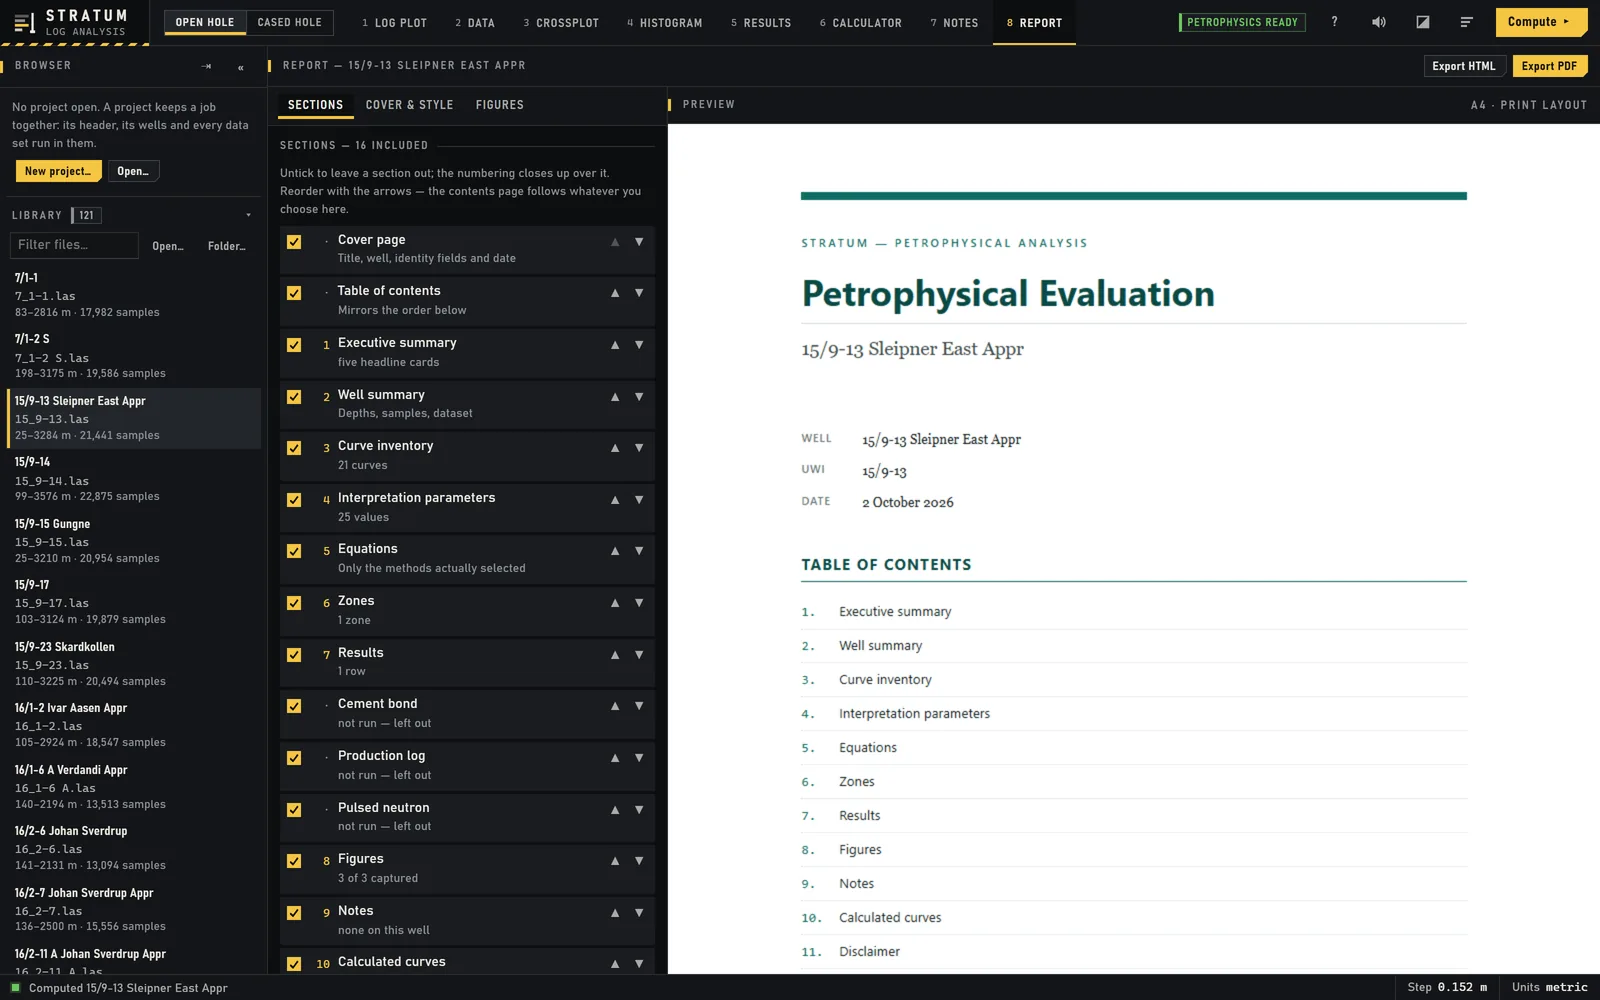
A report that starts from the job information. Choose and order the sections, then export it as a web page or a PDF.

02 · Interpretation

Open hole and cased hole, in one place.

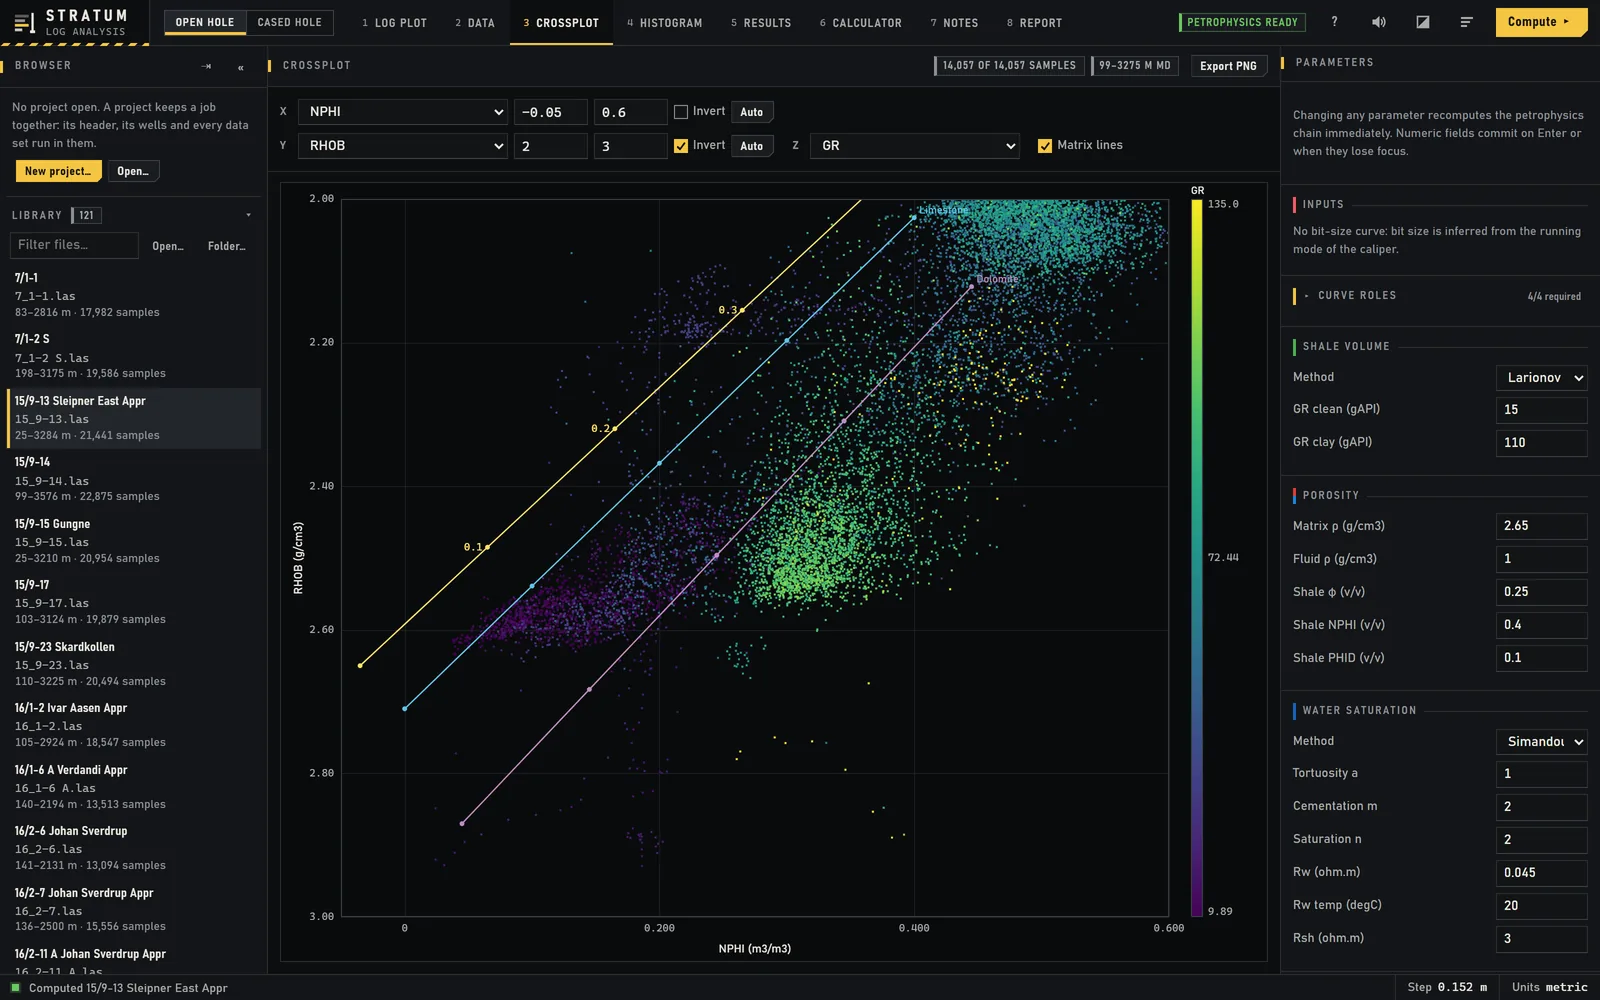
Change a parameter and the chain recomputes straight away. Crossplots and histograms are there to set the parameters, not just to look at.

A density and neutron crossplot coloured by gamma ray, with sandstone, limestone and dolomite lines
Open hole

From gamma ray to net pay.

  • Shale volumeFrom gamma ray: linear, Larionov, Clavier or Steiber, with the clean and clay endpoints picked on a histogram.
  • PorosityFrom density, or neutron and density together, then corrected for shale.
  • SaturationArchie, Simandoux or Indonesia, with every constant in plain view.
  • Net payCutoffs on shale volume, porosity and saturation, summed per zone with net to gross and hydrocarbon pore volume.
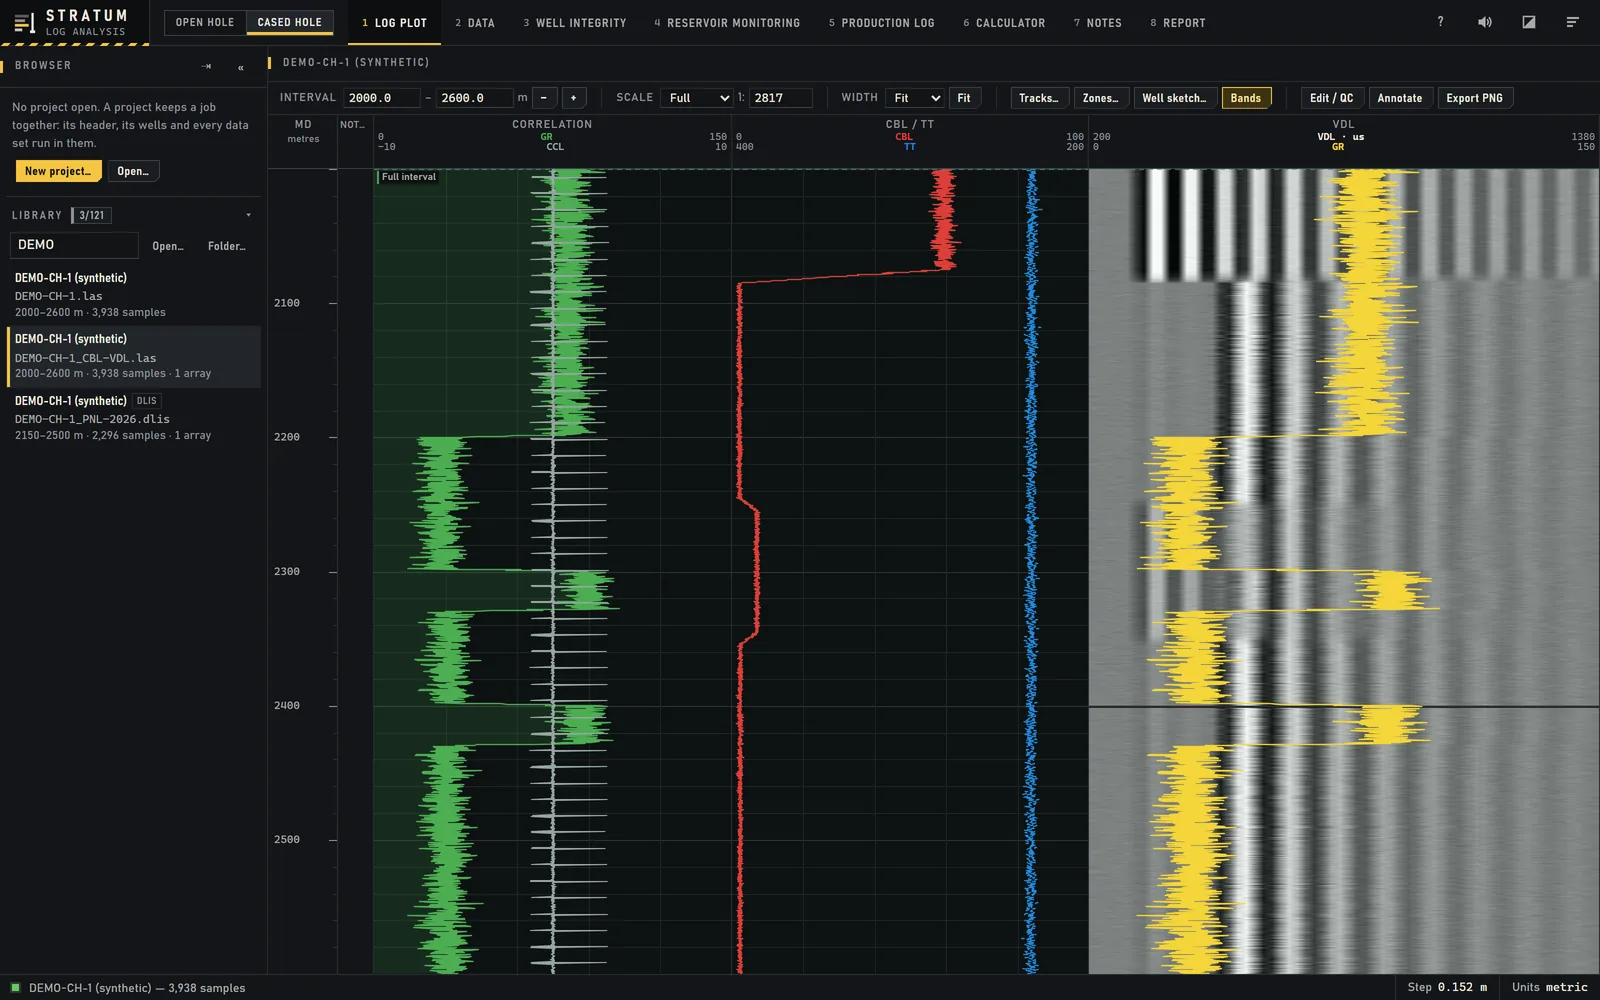
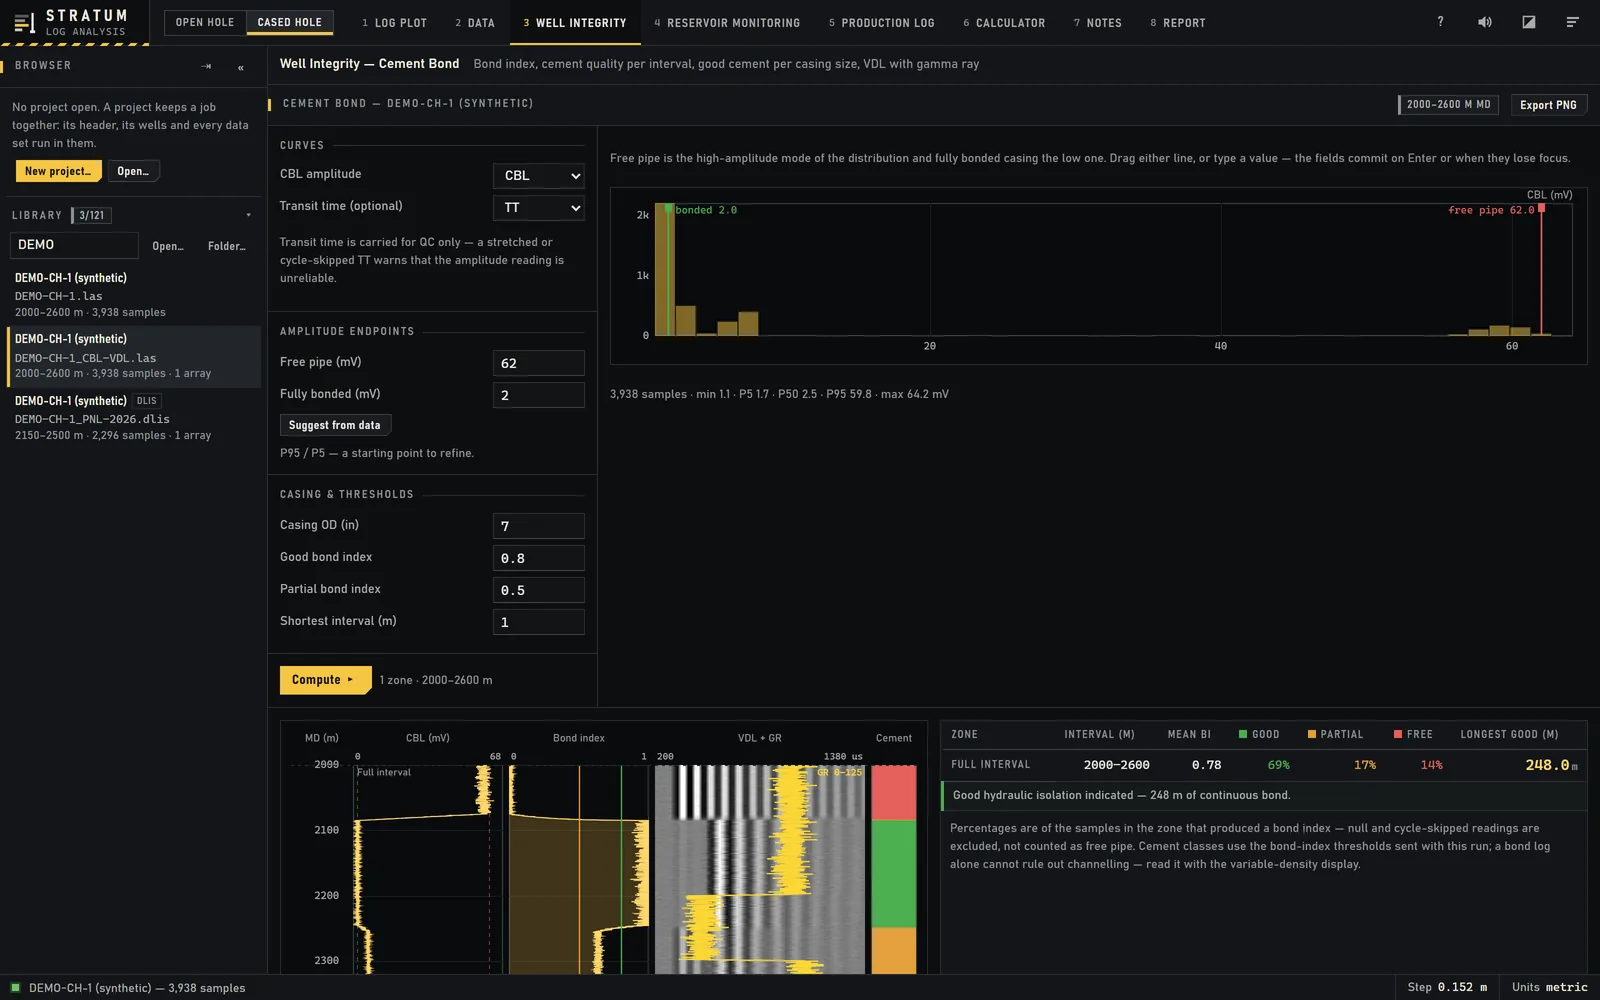
A cased hole log plot: gamma ray and casing collars, cement bond amplitude and transit time, and the VDL waveform image
Cased hole

Cement, saturation and flow.

  • Well integrityBond index from the cement bond log, cement quality per interval, and the VDL with gamma ray beside it.
  • Reservoir monitoringPulsed neutron sigma to water and oil saturation, and the change between passes over time.
  • Production loggingSpinner calibration against tool speed, and a flow profile by zone.
03 · Where it runs

On a desk, or for a whole team.

The interface talks to a Python engine that does the numbers. The same app runs on one machine or on a server.

Windows

One installer, with nothing else to set up. No Python, no extra tools.

macOS

A standard disk image for Mac, with the same features and the same project files.

Hosted for a team

Runs on a server behind a secure address and a sign in, so a team can use it with nothing installed on their machines.

Built and tested on FORCE 2020, a public set of 118 wells from the Norwegian North Sea, plus a synthetic cased hole well that exercises the cement bond, pulsed neutron and production logging tools.

In testing

Work with well logs?

Stratum is being tested now. If you read logs and would like to try it on your own data, write to us.